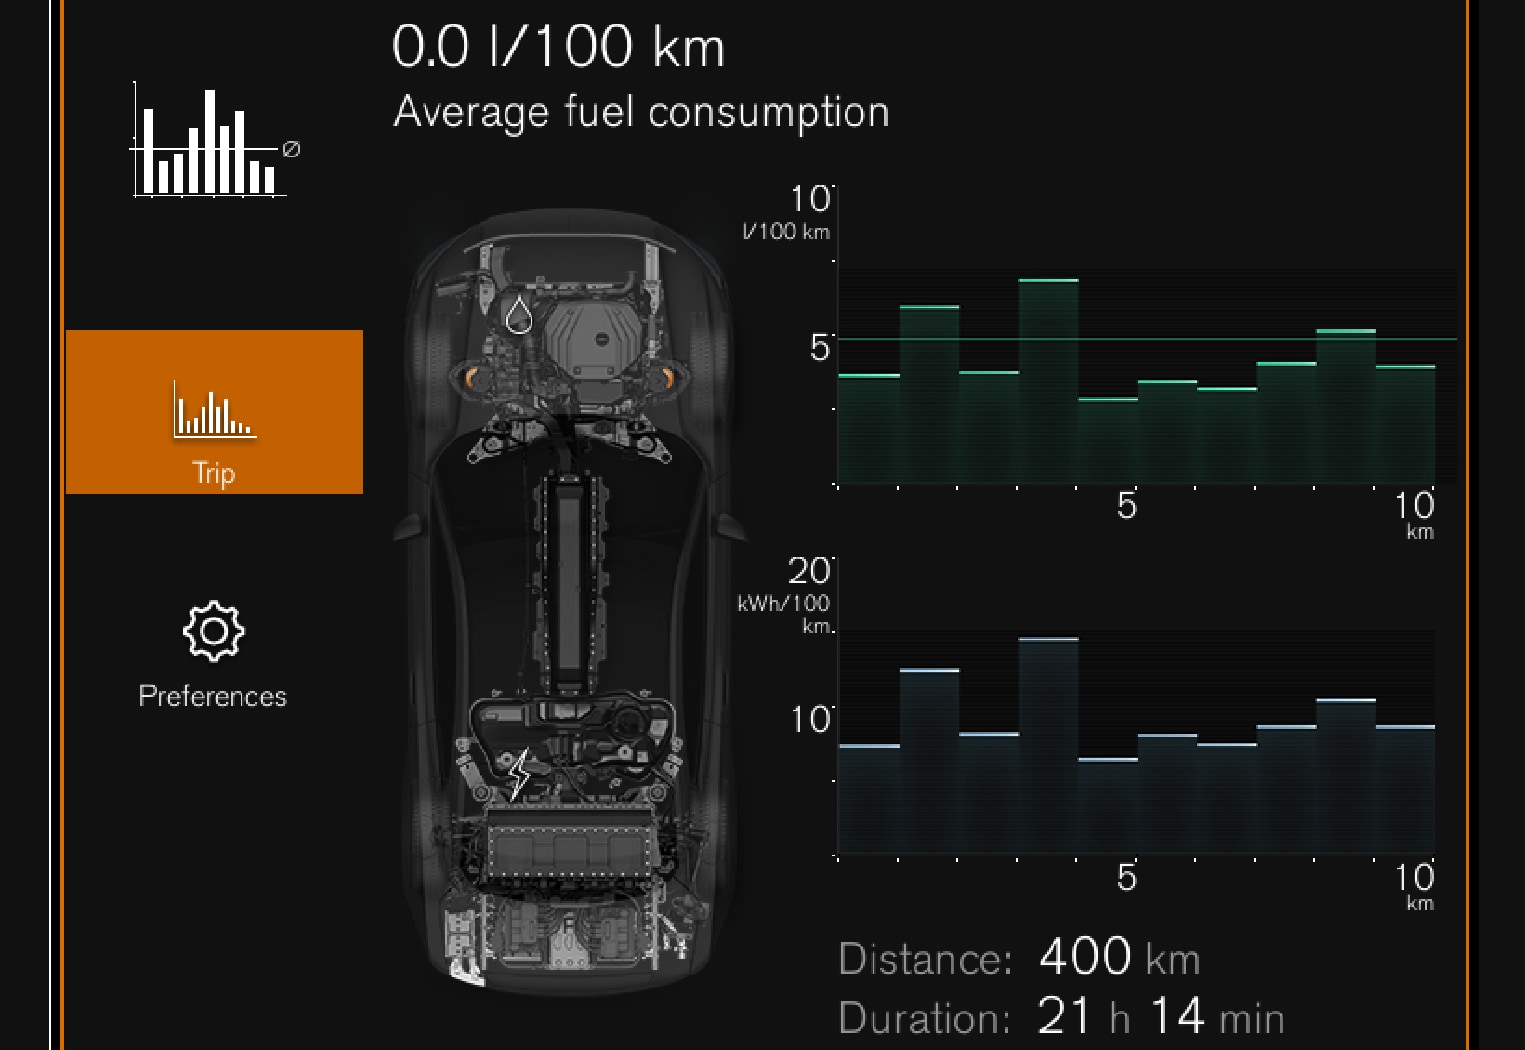
Displaying trip statistics in the center display
Trip computer statistics can be displayed graphically in the center display, providing an overview that facilitates more fuel-efficient driving.
Open the Driver performance app in the App view to display trip statistics.
Each bar in the graph represents a driving distance of 1 kilometers, 10 kilometers or 100 kilometers (or miles). The bars are added from the right as you drive. The bar at the far right shows the data for the current trip.
Average fuel consumption and total driving time are calculated from the most recent reset of the trip statistics.
Fuel and electricity consumption are shown in separate graphs. The electricity consumption shows "net" consumption, i.e. consumed current minus regenerated current generated by braking.